tardis
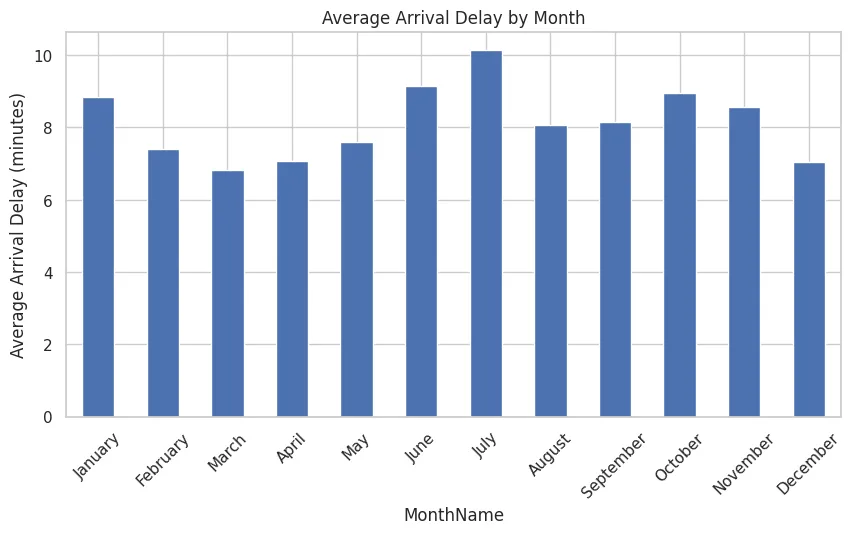
Why are French trains late? Most of the work was on the data itself: we took a deliberately messy SNCF export, cleaned years of punctuality records route by route, and explored them until the patterns showed, from delay causes to the worst routes and the worst months. Prediction models and an interactive dashboard came on top of that groundwork.
Team
3 people
Context
Epitech project, 1st year
Status
Done
Context
Epitech data-science project built on SNCF's monthly punctuality statistics, one row per month and per departure/arrival station pair. The export was made messy on purpose, so the first challenge was to trust the data before drawing any conclusion from it.
What was built
- Data cleaning: duplicates removed, broken dates repaired, negative and fractional train counts fixed, inconsistent delays dropped, station names normalised, missing values filled, and new columns (year, month, route, high-delay month) derived
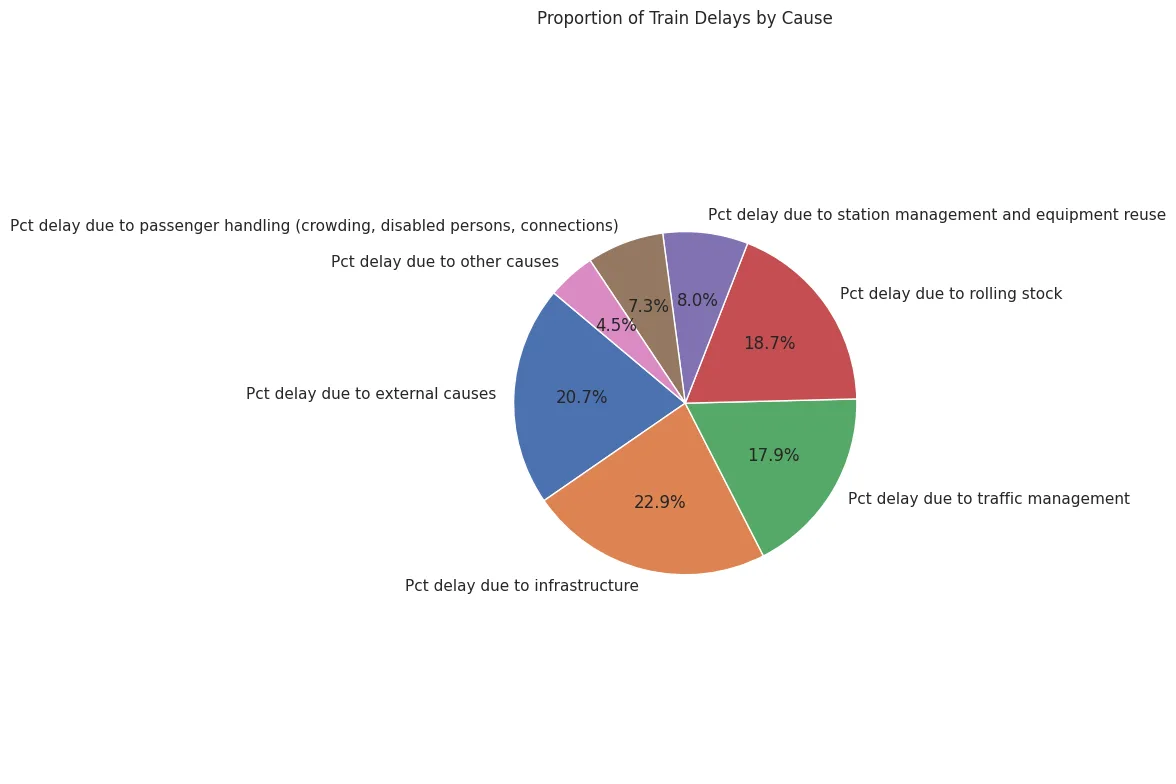
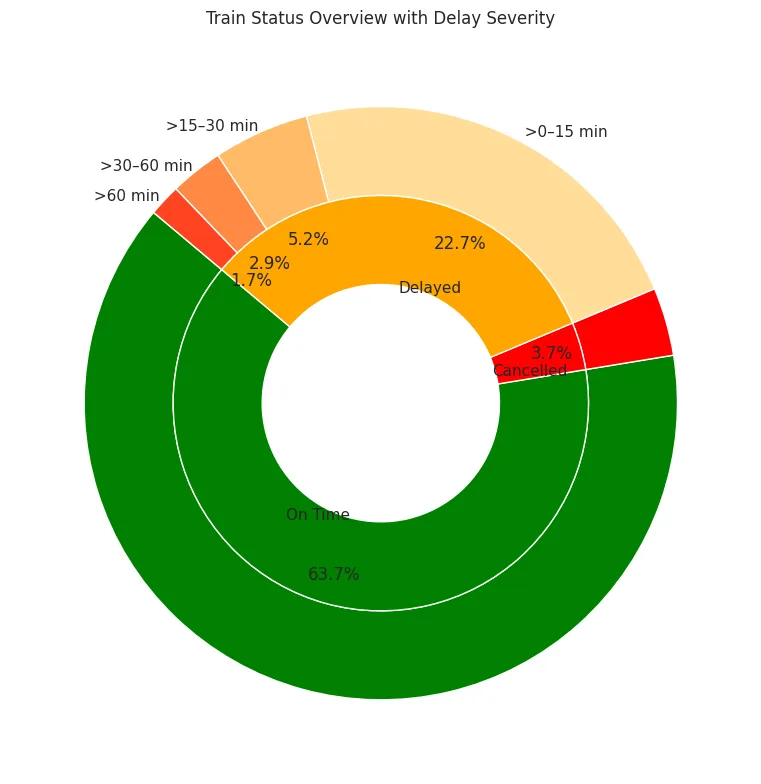
- Exploratory analysis: scheduled vs cancelled trains month by month, how departure and arrival delays relate, the share of each delay cause, the 50 routes with the longest delays, breakdowns by month and day of the week, and how delays are distributed
- Models on the cleaned data: regressions (linear, decision tree, random forest) to predict average delays, and classifiers for the risk of at least one cancellation, compared with RMSE, R², accuracy and ROC AUC
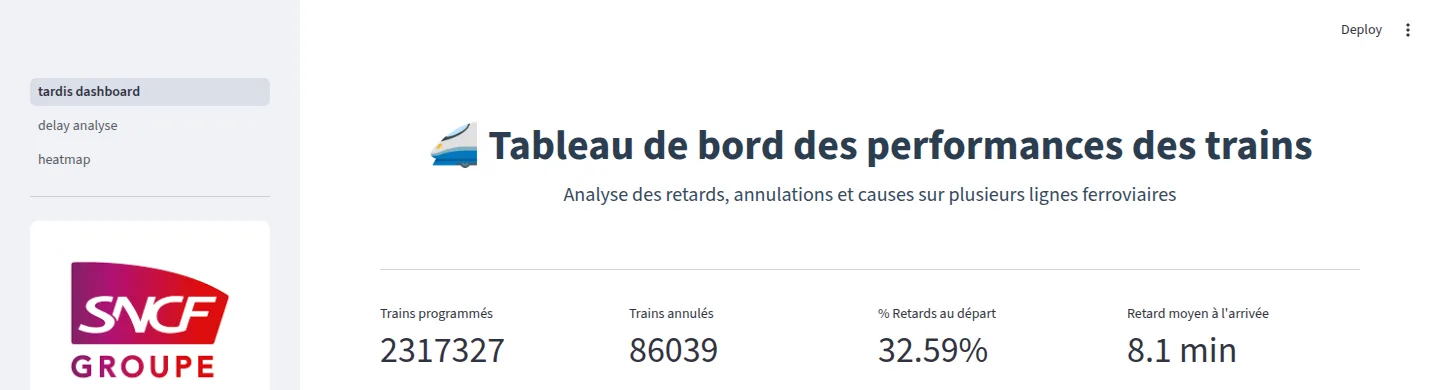
- A multi-page Streamlit dashboard: key figures, monthly trends, a view per station pair, and a correlation heatmap of the delay causes